Tuesday, 26 April 2011

#3 Spreadsheet Basic Formatting

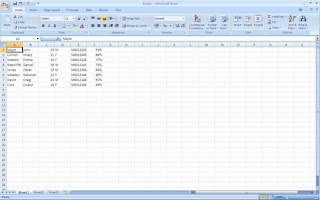
Once raw data is entered onto the worksheet, we need to apply various formatting to make the worksheet look more attractive and also to be able to interpret what the data is trying to show. Take a look at the worksheet below:


As you can see some data has been entered on the worksheet. Active cell has a reference of A1. However without any headings or formatting one cannot tell what the data represents. Try carrying out the following instructions:
  1. Insert an entire row: Select the home tab, go to group named cells and select the command button labelled Insert with a little arrow. Now click Insert sheet Rows.

  2. Enter the following:
    In cell reference A1 write: Surname
    In cell reference B1 write: First Name
    In cell reference C1 write: Age
    In cell reference D1 write: Gender
    In cell reference E1 write: Student ID
    In cell reference F1 write: Attendance
  3. Select cell reference A1 hold the right button on the mouse down and drag cursor from A1 to F1 to select all cells from A1 to F1.
  4. Making the selected cell range bold: Select the home tab, go to group named font and select the command button labelled with a bold B.
  5. Formatting row size using AutoFit: Select the home tab, go to group named cells and select the command button labelled Format with a little arrow. Now click AutoFit Column Width.
  6. Select cell range from A1 to F9.

Monday, 25 April 2011

#2 Exploring the Home Tab

The Home tab ribbon contains many of the basic excel formatting functions that you will refer to EVERY time you create a new spreadsheet. It consists of 7 groups and upon scrolling over each command button a little note pops up to inform the user of the function of the button.

1. Clipboard


2. Font


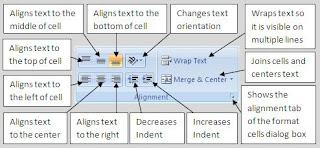
3. Alignment


4. Number


5. Styles


This group offers more complex formatting. The first command button allows users to apply conditional formatting. This can be used in many ways, for example, for a set of exam results, you can use that button to perhaps change colour of all results that are below the pass mark.

The second button, Format as Table, allows you to format the table as a whole (you'll need to highlight the whole table first). It offers different formatting for the headings of table compared to the rest of the rows. You can either apply any of the format already stored or customise it to your own preference.

The last button, Cell Styles, allows you to change a single or multiple cell styles. You can change background colour or add coloured underline or change font. We'll be using these command buttons in later posts.

6. Cells


The first command button, Insert, allows the user to insert cells, entire columns or entire rows and sheets.

The second command button, Delete, allows the user to delete cells, entire columns or entire rows and sheets.

The final command button, Format, allows the user to re-size, change visibility of cells, protects cells and can allow users to do most, if not all of the functions of the Font, Alignment and Number Tab. It is particularly useful if you want to change multiple aspects of one cell or many cells.

7. Editing


The first command button is the AutoSum. This allows the user to get the total of adjacent cells (either consecutive cells in a row or in a column). The little arrow allows users to select other functions other than the AutoSum, like Average which takes the average in a similar manner or Count etc.

The command button below is Fill. This allows the user to copy a pattern onto adjacent cells. For example if you have a column with heading date, and you want to enter all the dates of January, you can enter the date in the first three cells under the heading date and highlight those cells along with another 28 cells below (as January has 31 days) and click the fill button, this would automatically fill the rest of the dates.

The next command button down is Clear. This allows the user to clear the entire cell or selectively clear just the contents of a cell, just the formatting or just the comments.

Use the comments section below if further clarification is needed. Also we'll be referring to each of the buttons in later posts with images of examples to show the effects of these buttons.

#1 Introduction to Excel and Terminology

Microsoft Excel is a very versatile program. Although it is mainly used to process numeric data, (i.e. creating tables, analysing data, inserting formulas, creating charts) it can even be used simply for record keeping like a mini database (i.e. registers or staff records etc).

Before we start it is a good idea to get familiar with Excel related terminology. The diagram below labels all main components that make up an Excel Spreadsheet. You may click the image to view an enlarged version.

  • A workbook is the entire file containing all worksheets, charts etc.
  • The Office button allows the creation of new workbooks, or open previously saved workbooks, print or save active workbook and go into advanced options.
  • The tab brings up a ribbon containing groups of related command buttons.
  • Active cell references are shown in the box below the ribbon, on to the right in the formula bar, it shows exactly what is entered in the active cell
  • worksheet is the actual sheet containing columns and rows of cells where data may be entered.
  • The worksheet tabs allow users to scroll through various worksheets within the workbook.
  • The zoom slider allows users to enlarge or reduce the size of the worksheet.